|
Majid Mohammadian,
Ph.D., P.Eng. Associate Professor Department of Civil Engineering University of Ottawa 161 Louis Pasteur, CBY A114 ,Ottawa,
Ontario, Canada, K1N 6N5 Tel: (613) 562-5800-ext 6492, Fax:
(613) 562-5173 Email: majid.mohammadian@uOttawa.ca |
|

|
Research on Desalination |
|
Projects
1- Environmental impact assessment of
major desalination plants in Qatar under changing climate
2-
Mixing
study in North Saskatchewan River, Canada
2.1.
Mixing study of the outfall of Agrium Redwater (North
Saskatchewan River, Canada)
2.2. Mixing study of the outfall of
Capital region Waste Water Treatment plant (North Saskatchewan River, Canada)
2.3. Mixing study of the outfall of Goldbar Waste Water Treatment plant (North Saskatchewan
River, Canada)
3- Three Dimensional numerical simulation
of submerged outfalls
4-
Three
Dimensional numerical simulation of surface outfalls
5-
Three
dimensional numerical simulation of thermal outfall of a Petrochemical Complex
in Persian Gulf
6-
Numerical
Modeling of Mixing and Transport of Ammonia in Ottawa River, Canada
7-
Nitrification
Kinetics & Modified Model for the Rideau River, Canada
8-
Biosorption of Pb and Cu Using
Fixed and Suspended Bacteria
9-
Hydrodynamic
modeling of Mooney's Bay, Canada
Environmental impact assessment of major desalination
plants in Qatar under changing climate
Project
Director: Majid Mohammadian
Students: Hossein Kheirkhah, Vahid Pilechi, Amir Gharavi, Hamidreza Shirkhani
Collaborators: Ioan Nistor, Hazim
Qiblawey, Colin Rennie, Ousmane Seidou
a. Project
summary
Desalinated sea water is the main
source of potable water in Qatar. Nearly 60% of desalination plants in the
world are located in the Gulf, and some of the largest are located in Qatar.
Evaluation of the environmental impacts of desalination plants is an important
issue. The increased temperature and salinity of the discharge may cause
problems for the ecosystem. There are strict international regulations on the
level of required dilution of the concentrated outfall of desalination plants
in order to protect aquatic life and the ecosystem. For example, strict criteria for discharge
salinity have been set by the Environment Protection Agency; the salinity
within 50 metres of the discharge point, must be within plus or minus 1.2 parts
per thousand (ppt) of background levels. By the time
the discharge is more than a kilometre offshore, salinity must be within 0.8 ppt of background levels. Similar criteria exist for the
temperature of the discharge.
This research focuses on two selected
plants in Qatar where field measurements, laboratory experiments, and numerical
simulation are used to study dispersion and dilution of the concentrated brine.
The results are analyzed and compared with available regulations.
In order to evaluate future
environmental impacts of desalination plants under the changing climate,
various climate change scenarios will be considered and the projected results
of general circulation models will be downscaled and employed in numerical
simulations.
|
|
|
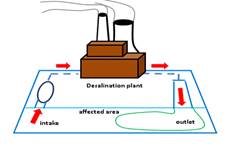
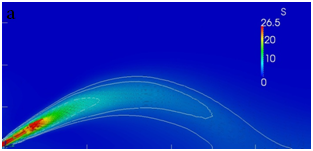
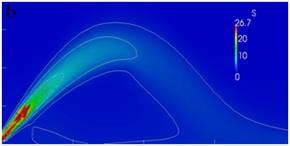
(Fig. 1)
Dispersion of hypersaline brines (left) and
upwelling of warm plumes (right). |
b. Numerical
modeling
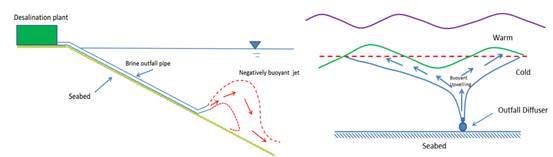
A
Three-level flow model was set up and ran for spring tidal condition of
February 2012. The prepared model is based on domain decomposition concept and
uses two-way communications between different levels. The largest model (Level
1) is a 2D model which starts from the Hormuz strait and covers the entire gulf
by a Cartesian structured grid with 3km resolution. The water level boundary
condition was used in this model from IHO buoys data at Farur
and Siri Islands, Lengeh port; and Ghanada estuary (Fig.1).
(Fig. 2) Model level 1 extension and the
location of the available IAHR tidal buoys
The
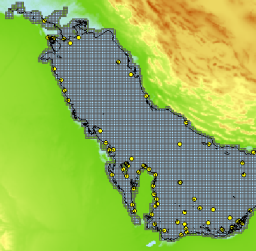
model results were calibrated and verified using IHO’s buoys data, Halul and UMM-Said respectively.
|
|
|
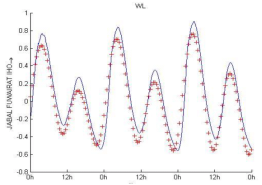
(Fig. 3) Results of calibrated numerical model
(continuous line) and IHO gauges data at Halul (left)
and UMM-Said (right) stations
The
intermediate level model (Level 2) is nested in model Level 1 and covers Qatar
eastern coasts (where the selected sites located) with 500m grids. This model
is also 2D and is used to simulate the tidal currents in the region of interest
(Fig. 4)
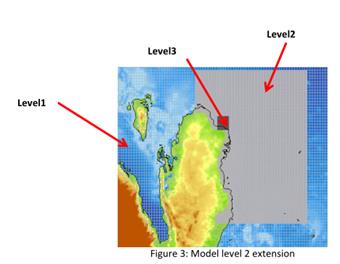
(Fig. 4)
The
results were calibrated and verified using the IHO buoy data, Jabal Al Fuwayrit and Al Wakrah, respectively.
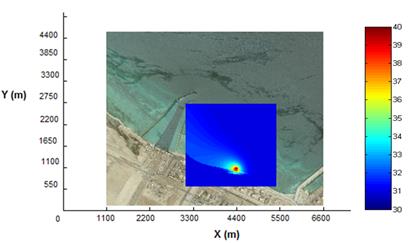
Model
Level 3 is a 3D model which surrounds the region Ras
Al Lafan desalination plant outfall by a 10KM*10KM
region of 100m resolution the model was run for simulating the dispersion of
the discharged effluent (Fig. 5).
|
|
|
|
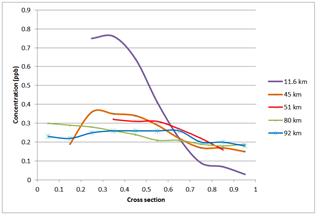
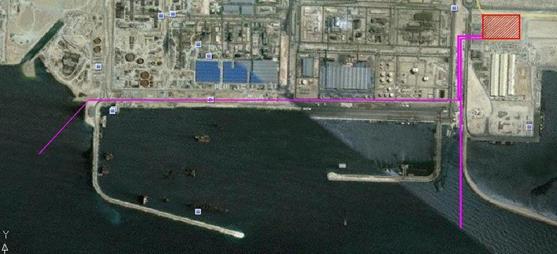
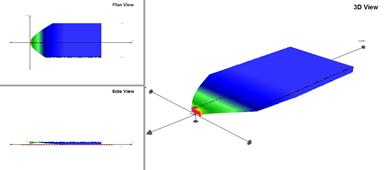
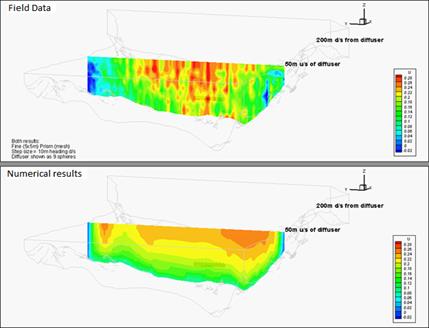
(Fig. 5)
Simulation result from Level 3 (left) for salinity dispersion under tidal
conditions |
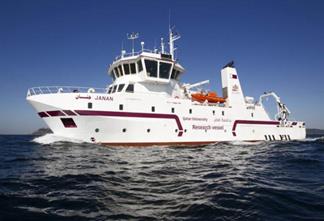
(Fig. 6)
Research Vessel Janan (Qatar University) used for
field study |
In
the next step, a wave model was set up and coupled with the flow model. The
wave model was set up in 2 Levels on the same grid as the Level 1 and Level 2
of the flow model. The results of the coupled wave-flow model were also
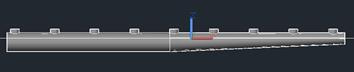
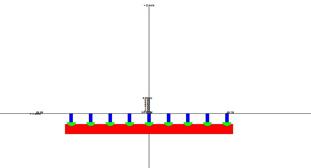
calibrated with buoy data. We have also investigated the effect of multiport
diffuser on maximizing the near field mixing (Fig. 5).
c.
Field work: The field work is currently
carried out using following equipment
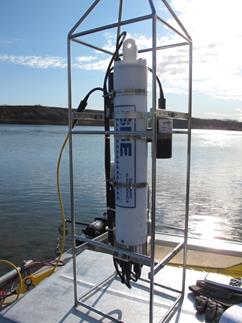
A CTD is primarily designed to measure salinity, temperature and depth using conductivity, temperature and pressure sensors respectively. Due to availability of recent technology developments and invention of new in situ sensors, the CTD utilized in the present study integrated an additional fluorometer and a turbidity sensor. A CTD is lowered down into the water and continuously records data from each of its sensors. The fluorometer used in the present study is suitable for detection of Rhodamine WT concentrations ranging from 0.01 ppb to 230 ppb with 0.01 ppb sensitivity (i.e., resolution). Rhodamine WT concentrations were recorded with a sampling frequency of 4Hz.
|
|
|
|
(Fig.
7) Seabird CTD SBE19plusV2 |
(Fig. 8): ADCP |
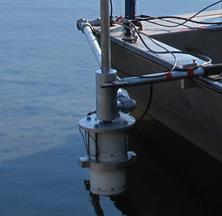
Depth averaged velocity and bed elevation was measured using a SonTek M9 Riversurveyor ADCP. An ADCP measures spatial averages of the three principal water velocity components in individual “bins” throughout a vertical column of water, and can be operated from a moving vessel. ADCPs use the Doppler principle to measure water velocities, utilizing four acoustic transducers. Each transducer is orthogonal to the others (spaced at 90º around the circle), and angled from the vertical (at 25º for the present instrument). From each of the four transducers, an acoustic pulse (“ping”) is transmitted. The acoustic pulse scatters off particles in the fluid, which are assumed to be traveling at the velocity of the fluid. The frequency of the scattered sound is changed due to the Doppler shift related to the velocity of the particles. The backscattered sound is received by the transducer, and the along-beam component of particle (fluid) velocity is estimated based on the observed Doppler shift. Furthermore, the backscattered sound is “range-gated”, meaning it is processed in sequences, which allows for determination of velocity at sequential depths (“bins”) below the instrument. A coordinate transform allows for estimation of the three Cartesian velocity components at all depths below the instrument. A separate “bottom track” (Doppler sonar) pulse is used to measure the local water depth and the speed of the vessel. Lastly, an on-board compass allows for rotation of the measured velocities into Earth coordinates (East, North, Up).
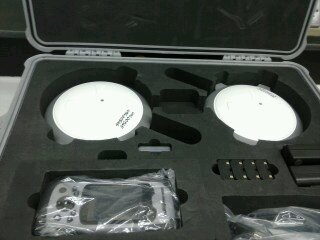
A survey grade dual frequency
real-time kinematic (RTK) Global Differential Positioning System is employed on
the boat to locate the measurements. The
GPS was manufactured by Novatel, and included a Novatel DL-V3-L1L2 base
receiver and a Novatel Propak LB+ rover receiver with
reported relative horizontal position accuracy of ±2 cm CEP (i.e. 50% of
position estimates have error < 2 cm).
The precision of the RTK-DGPS system was previously evaluated by Rennie and Rainville (2006),
wherein average error of measured RTK-DGPS velocity equalled 2.6 cm/s. Position data are collected at 10 Hz, and
were integrated into the CTD and ADCP data sets for correct positioning and
synchronization of the CTD and ADCP data.
|
|
|
|
(Fig. 9)
GPS-RTK system |
(Fig. 10)
Anemometer |
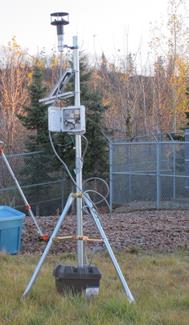
Wind speed and direction were measured using a WindSonic anemometer. This instrument include the anemometer sensor, a data logger, and a solar battery. The data were collected with 4Hz frequency with 0.01m/s and 1º resolution for velocity and direction, respectively.
Mixing study in North Saskatchewan River, Canada
Student: Vahid Pilechi
Supervisor: Majid Mohammadian
Co-supervisor: Colin Rennie
Collaborator: David Zhu
The objective of this project was to measure spatially distributed tracer concentration and water velocity in the mixing zone, such that dispersion patterns could be determined.
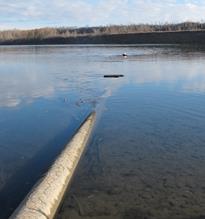
Rhodamine WT was used a tracer of plant effluent. The tracer
concentration was tracked from a boat moving both across and along the river
using an in situ fluorometer
integrated into a Conductivity-Temperature-Depth (CTD) instrument. Physical water samples were also collected at
various locations in the river for subsequent laboratory analysis of rhodamine concentration.
The measured physical sample rhodamine
concentrations suitably verified the in
situ fluorometer results.
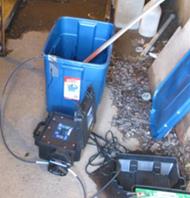
Peristaltic pump for very slow injection of rhodamine into the outfall
The river hydrodynamics were also measured using a Riversurveyor Acoustic Doppler Current Profiler
(ADCP). The ADCP was mounted to the
survey vessel, and was specifically selected for surveying the relatively
shallow depths of the North Saskatchewan River in October. An anemometer was also set-up near the
outfall to monitor wind speed and direction.
The CTD and ADCP data were collected simultaneously
and synchronized by means of Global Positioning System (GPS) position and
time-stamp data that were integrated into the data streams collected by both
the CTD and ADCP. The survey was
conducted by collecting data along multiple transects in each reach.
The rhodamine concentration
reduced gradually along the river path as the tracer mixed with ambient water.
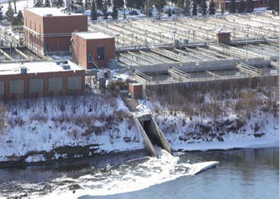
Mixing study of the outfall of Agrium Redwater (North
Saskatchewan River, Canada)
Student: Vahid Pilechi
Supervisor: Majid Mohammadian
Co-supervisor: Colin Rennie
Collaborator: David Zhu
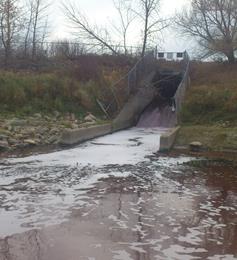
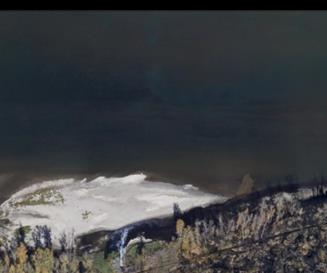
Agrium Redwater is a fertilizer producing plant, with approximate outfall discharge of 4600m3/day to North Saskatchewan river.
|
|
|
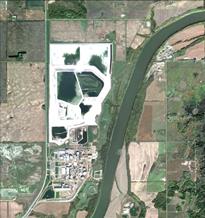
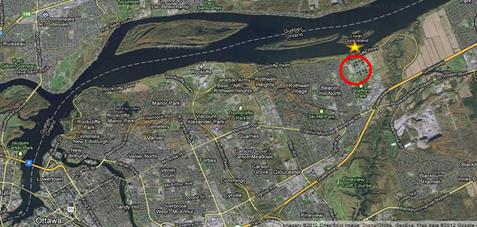
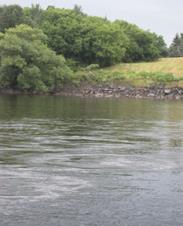
Agrium Redwater outfall (Left) +and site location
(right) adopted from Google Earth.
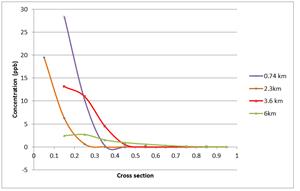
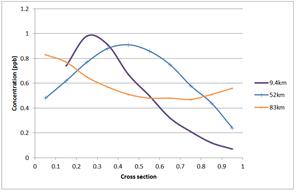
The gradual mixing of effluent with ambient water is observed in the Agrium results within the surveyed distance. At 12km from the outfall location, river flow is separated due to the presence of an island in the middle of the river section. The consequent complex flow pattern leads to a uniform rhodamine concentration distribution across the last surveyed section in the right-hand channel. However, the left-hand channel at 11.5 km did not display a uniform concentration distribution, thus, full mixing was not observed.
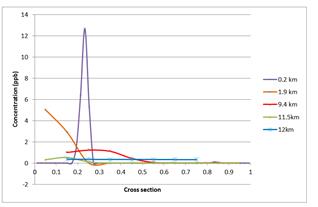
Mixing trend along river path from Agrium surveying results, based on
mean rhodamine concentrations at each section.
Location across the section is non-dimensionalized
such that the left bank is at 0 and the left bank is at 1
Mixing study of the outfall of Capital
region Waste Water Treatment plant (North Saskatchewan River, Canada)
Student: Vahid Pilechi
Supervisor: Majid Mohammadian
Co-supervisor: Colin Rennie
Collaborator: David Zhu
Capital region Waste Water Treatment plant (WWTP) is the fourth-largest treatment facility in Alberta. It treats the wastewater and sewage needs of more than 200,000 people each day and the current capacity of this plant is 140 ML/d.
|
|
|
The outfall is located in the right bank side of the river. So the rhodamine concentration was higher in the left bank side in sections closer to the outfall. The rhodamine concentration was 0 in the left bank side in initial sections. It required about 6 km for rhodamine to first reach the left bank .
Following the river path, rhodamine gradually mixed and the difference between rhodamine concentration in left and right bank sides reduced. In the last surveyed section at about 83km from the outfall, the average rhodamine concentration in the left bank was 0.83ppb against 0.56ppb in the right bank side.
In Capital Region WWTP the 100ppb difference between rhodamine concentration in right and left bank side of the river decreased continuously along the river. As previously mentioned, because rhodamine was injected from the right bank into the river, it was highly concentrated in the right bank side of the river and measured concentration on the left bank side was 0 for initial sections. The rhodamine reached the left bank at the 6km section from the outfall. The high rhodamine concentration difference between left bank side and right bank side reduced from 100 ppb at the outfall to 0.27 ppb at the 83km section. However, this value is still 46% of the average rhodamine concentration at the 83km section, which means that the full mixing condition was not achieved.
Mixing study of the outfall of Goldbar Waste Water Treatment plant (North Saskatchewan
River, Canada)
Student: Vahid Pilechi
Supervisor: Majid Mohammadian
Co-supervisor: Colin Rennie
Collaborator: David Zhu
Goldbar WWTP is located in the North Saskatchewan River Valley. It treats waste water for 700000 people. The current capacity of this plant is 82MGD (310 ML/d).
|
|
|
Goldbar WWTP site locationleft picture from Drainage
Information Systems Drainage Services, and site
location (right) (right picture adopted from Google Earth)
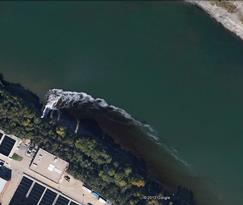
For Goldbar WWTP the outfall location is located on the right bank, thus in the initial sections rhodamine was concentrated on the right half of the river and the concentration was 0 on the left bank side. The first section in which rhodamine concentration was observed on the left bank side of the river was located at approximately 11.6km from the outfall location.
Downstream of where the effluent reaches the left side of the river, measured concentration continues to be higher on the right bank side compared to left bank side. The high concentration difference between right bank and left bank at the outfall (about 13 ppb) reduced to 0.11 ppb at the 80 km section. For the 92 km section this difference reduced to 0.05 ppb. However, the 95% confidence intervals for concentration at the right bank and left bank at the 92 km section do not overlap, so it appears that full mixing still has not been achieved. Still, the difference across the section of 0.05 ppb is only 20% of the average sectional concentration of 0.23 ppb.
Mixing trend along river path (11.6km to 92km section) from Goldbar WWTP surveying results, based on mean rhodamine
concentrations at each section. Location
across the section is non-dimensionalized such that
the right bank is at 0 and the left bank is at 1
Three dimensional numerical simulation of
submerged outfalls
Student: Hossein Kheirkhah
Supervisor: Majid Mohammadian
Co-supervisor: Ioan Nistor
Effluent discharges from industrial power plants into coastal
and river waters have been increased dramatically during the past decades. It
is a major concern in the developing countries located at the Persian Gulf
region where most of them use desalination plants to provide sufficient potable
water for their populations. Environmental impacts of effluent discharges on
the recipient ambient ecosystem are unavoidable. Therefore, mixing and
dispersion characteristics of the different jets resulting from the outfalls
have to be studied accurately. As a part of Qatar Project, the near-field area
of discharge point has been numerically modeled using OpenFOAM
CFD package. This model works based on Finite Volume Method (FVM). Various RANS
turbulence models have been applied in the numerical model to find the best
ones to predict geometrical and mixing characteristics of both positively and
negatively buoyant jets issued at an angle into ambient water. Very simple
turbulence models such as standard k-ε have been examined as well as more
advanced models like Reynolds Stress Models (e.g. LRR model) which have not
been investigated for the similar problems before. The numerical results showed
good agreement with the experimental data for the models using realizable
k-ε and RSMs turbulence models.
Velocity vector map of LRR model for a
positively buoyant jet. (a) tank
width=0.4 m.( b) tank width=0.8 m. (c) tank width=1.2 m.
Velocity vector
and concentration contour maps for a:30° and b:45°
inclined jets (realizable k-ε turbulence model)
Three dimensional numerical simulation of surface
outfalls
Three dimensional numerical simulation of
thermal outfall of a Petrochemical Complex in Persian Gulf
Students: Peter Bradley, Joel Hernberger, Desmond Lam, Jeffrey Miller,
Michael Pelletier
Supervisor: Majid Mohammadian
Dispersion of thermal plumes of
a plant in Persian Gulf
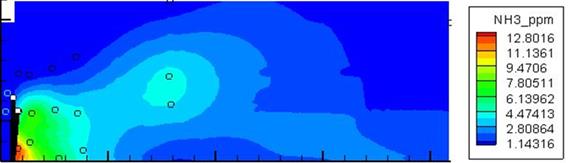
Numerical Modeling of Mixing and Transport of Ammonia in
Ottawa River, Canada
Student: Ivana Vouk
Supervisor: Majid Mohammadian
Co-supervisors: Colin Rennie , Robert Delatolla
Nitrification
Kinetics & Modified Model for the Rideau River, Canada
Student: Lianmiao Zhao
Supervisor: Robert Delatolla
Co-supervisor: Majid Mohammadian
Improving kinetic modeling of nitrification in rivers is of growing importance due to yearly increases in the anthropogenic release of nitrogen into rivers around the world. The use of water quality models can abate the expense of water quality monitoring while enabling the user to predict trends of variation. Data collected from a series of laboratory kinetic experiments were used to calculate the rate of nitrification in the Rideau River, Canada, and modify nitrification algorithms used in the traditional water quality model Qual2E. The modified model relates the reaction rate coefficients with a simple biomass concentration measurement of volatile suspended solids (VSS) in the river and subsequently introduces biomass growth functions directly into the kinetic algorithm. Furthermore, this modified model includes a nitrate-nitrogen assimilation pathway. The modified model demonstrates an improved correlation to nitrogen parameters observed in river water samples compared with the classical water quality model Qual2E. The inclusion of bacterial concentrations based upon the simple measurement of VSS plays a critical role in the reactions of the nitrification system and nitrate-nitrogen assimilation is an important pathway at low ammonia-nitrogen concentrations.
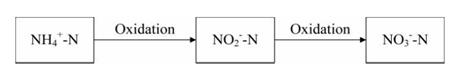
Schematic of two-step nitrification reaction process
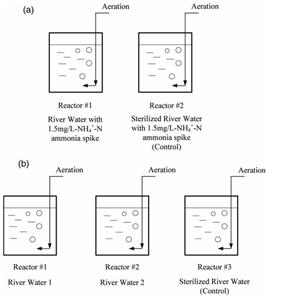
Schematics of bench-scale batch reactors, (a) model calibration experiments and (b) model validation experiments.
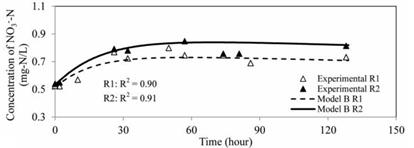
Model
validation
Biosorption of
Pb and Cu Using Fixed and Suspended Bacteria
Student: Ryan Black
Supervisor: Majid Mohammadian
Co-supervisor: Majid Sartaj
Biosorbents are a low cost option for heavy metal (HM) remediation. To compare HM adsorption capabilities between fixed and suspended morphologies of bacteria, batch adsorption tests of Cu and Pb were performed at 22 o C and neutral pH. A mixed bed bioreactor (MBBR) and a batch reactor were used to develop the fixed, biofilm bacteria and the suspended, planktonic bacteria, respectively. The dominant bacteria were identified by 16s RNA sequencing as Enterobacter ludwigii, Zoogloea ramigerais and Comamonas testosteroni. The two morphologies exhibited significant differences in percent dry weight and in EPS content.
The fixed bacteria, grown on carriers in a MBBR, displayed 29% EPS content by weight compared to 9.5% EPS found on the suspended bacteria, grown without substrate in a batch reactor. The adsorption data fit the Freundlich isotherm for all cases (R 2 values were 0.89 and 0.97 for Pb and 0.96 and 0.99 for Cu for fixed and suspended biomass, respectively).
The adsorption data fit the Langmuir isotherm for all cases except Pb on suspended biomass (the R 2 value was 0.91 for Pb on fixed biomass and R 2 values were 0.88 and 0.99 for Cu on fixed and suspended biomass, respectively). The Langmuir adsorption data for Cu revealed that the q max was greater for fixed bacteria, at 9.80 mg g -1 compared to 6.52 mg g -1 for suspended bacteria. The isotherm constants suggest that the fixed bacteria exhibit greater binding affinity for both HMs and that both morphologies have a degree of heterogeneity amongst binding sites.
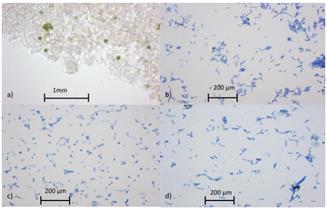
Image of fixed
bacterial biomass community taken at 40x magnification detached from the k1
carrier b) Image of Zoogloea ramigerais
rod-shaped bacterial cells taken at 100 x magnification.
c) Image Enterobacter ludwigii
rod-shaped bacterial cells taken at 100 x magnification. d) Image of Comamonas testosteroni rod-shaped
bacterial cells taken at 100 x magnification. Bacteria colony isolates grown on
nutrient agar.
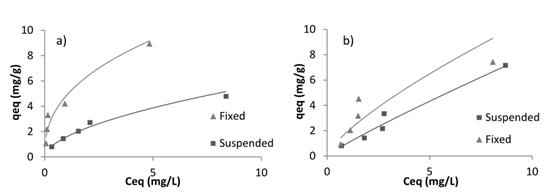
Freundlich isotherms comparing the adsorption capacity (q eq ), of suspended biomass
and fixed biomass at different equilibrium HM concentrations (c eq ). Fig a) is Cu adsorption and Fig b) is Pb adsorpti
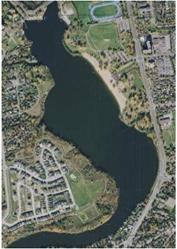
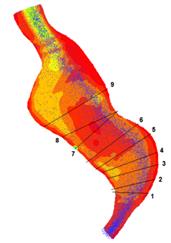
Hydrodynamic modeling of Mooney's Bay, Canada
Student: S. Kheradmand
Project Director: Majid Mohammadian
Collaborators: O. Seidou, C. Rennie, T. Odyemi
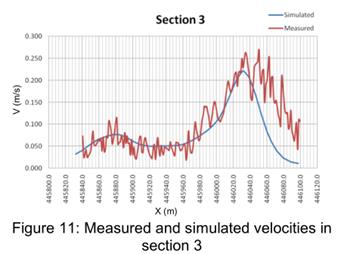
A shallow water model was developed for Mooney’s Bay on the Rideau River. Due to the complex geometry of the area, an unstructured grid has been employed. A high resolution upwind finite volume method based on characteristic decomposition is used to solve the depth averaged equations. A field survey has been also performed and velocity field and bathymetry have been measured using an Acoustic Doppler Current Profiler (ADCP). The flow characteristics in the bay have been analyzed and numerical results have been compared with measured data. The present model is the first step towards a coupled flow and ice development simulation in Mooney’s Bay.