Tutorial Example for the Use of the Computational Code
Star-CCM+
This tutorial example is designed to be self-standing and requires no previous familiarity with Star-CCM+. It is very similar to the Steady Flow: Backward Facing Step tutorial in the Tutorial Guide (accessed in the Help menu). It is strongly recommended that you familiarize with the location of buttons on the user interface, by going through the appropriate sections of the Star-CCM+ Tutorials and the User Guide. In particular, you should try the Introduction tutorial to familiarize yourself with the user interface and process of running a simulation. See Getting Started with Star-CCM+ for more information on accessing the Star-CCM+ tutorial guide.
PROBLEM: Compute incompressible, viscous, air flow through a circular pipe section containing an orifice plate.
Problem specifications
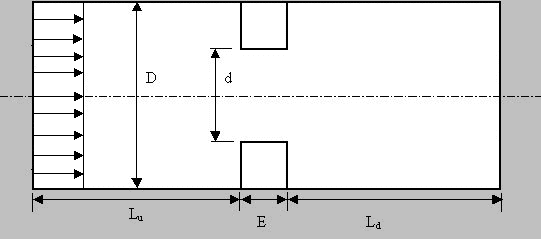
Consider a circular pipe section containing an orifice plate as shown in the figure below. Air enters the section with a uniform inlet velocity. Geometrical, material and kinematic specifications are given in the table below.
|
Variable
|
Value
|
Description
|
|
D
|
4 cm
|
Duct diameter
|
|
d
|
2 cm
|
Orifice diameter
|
|
E
|
1 cm
|
Orifice thickness
|
|
Lu
|
4 cm
|
Upstream duct length
|
|
Ld
|
5 cm
|
Downstream duct length
|
|
uniform profile
|
0.0001 m/s
|
Inlet velocity
|
|
r
|
1.2 kg/m3
|
Air density
|
|
m
|
1.8E-5 Pa-s
|
Air viscosity
|
|
Re=rumeanD/m
|
0.133
|
Reynolds number
|
Step 1. Start a new simulation
Follow instructions here to launch the program: Getting Started with Star-CCM+. Be sure to use the Power-On-Demand Key that was emailed to you.
Save the new simulation as probOrificePlate (with .sim extension)
Step 2. Sketch the profile
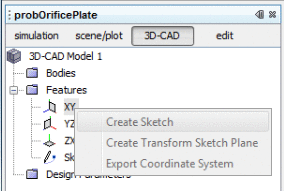
In the model window, expand the Geometry node and right click on the 3D-CAD Models node and select new.

In the model window (3D-CAD tab), expand and right click the Features > XY node and select Create Sketch. window.
Note the display options that appear under the edit tab in the model. Click the Click the Show Grid button  under Display Options to toggle the grid on/off
Click the Grid Spacing button  under Display Options and change to 0.01m and click OK. Zoom in and out by clicking on the display window and using the mouse wheel.
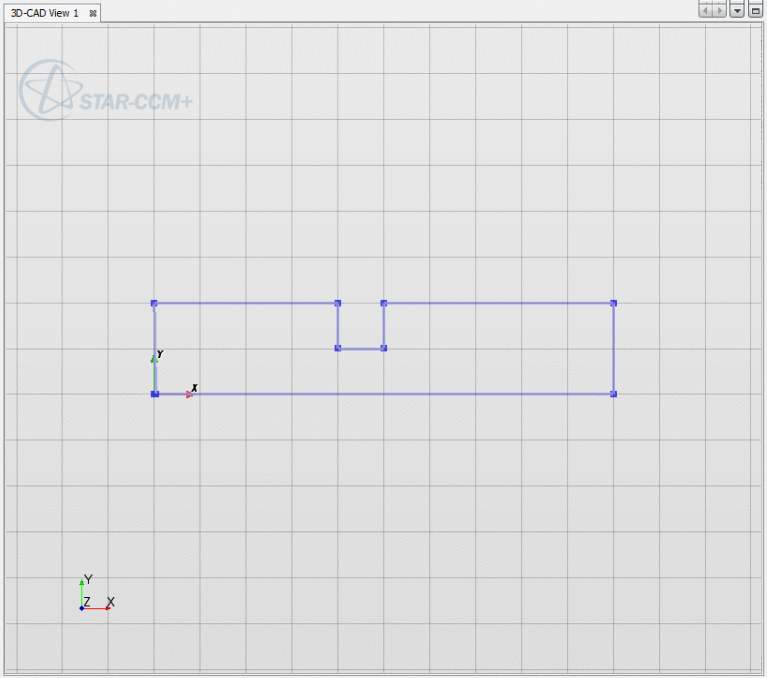
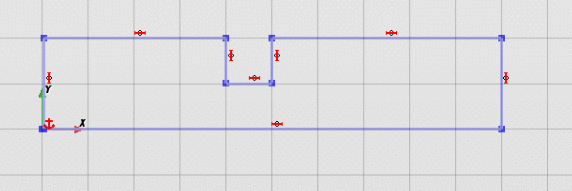
Draw the sketch shown below (ensuring that "snap" is on). To turn "snap" on, use the Snap to Grid button  under Display Options in the model window. Use the Create a Line button
  under Create Sketch Entities to create your line segments freehand, snapping to the grid at approximately the right locations. Note that you can take advantage of symmetry here. You only need to model half of the domain since we are assuming axisymmetric flow. Also you do not have to get the dimensions perfect at this point. We will add constraints to the lines and fix the lengths in the next step. Your window should look like this:
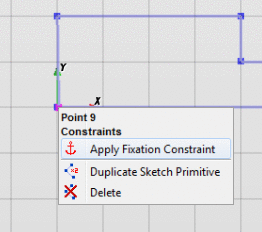
Now create constraints to fix the position, dimensions, and angles of all the lines.
To start, right click the lower left corner of the drawing, and click Apply Fixation Constraint.
Now right click in the middle of each line segment and click Apply Horizontal/Vertical Constraint to each and every line. This will force the lines to be either horizontal or vertical. Then repeat the procedure to Apply Length Dimension, useful fixing the length of each line segment.

To check the lengths of each line segment, left click on each line, and check the Length under the Line Properties window. Make sure each length matches the specification of the tutorial. You can also double check the active constraint for each line in this window.

Alternatively, you can right click each line segment and click Apply Length Dimension and edit the line length on screen. This is useful if you intend on running multiple simulations with different blockage ratios.
Your final drawing should look like this when complete:
Click OK and save your work!
Step 3. Extrude the profile
Right click the Features > Sketch 1 node and select Create Extrude

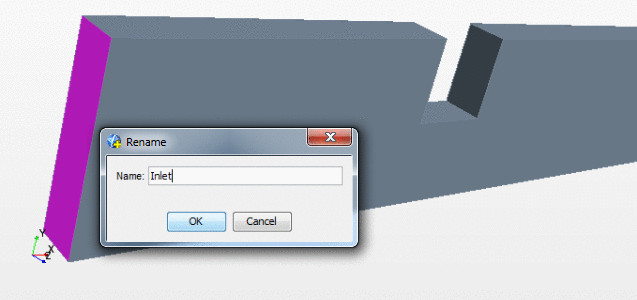
Set the distance box to 0.005m (something small). For now our object will be 3D, but it will be converted to 2D later. Rotate with the mouse to preview then click OK to generate. The model should now appear in the Bodies > Body 1 node. Right click the Body 1 node and Rename to orifice_plate.

Step 4. Specify the boundary face names.
Right click the left most face of the model and Rename to "Inlet"
Right click the remaining faces indicated in the figure below and name them accordingly. Note the side faces will not be named right now. They will show up later as Default.
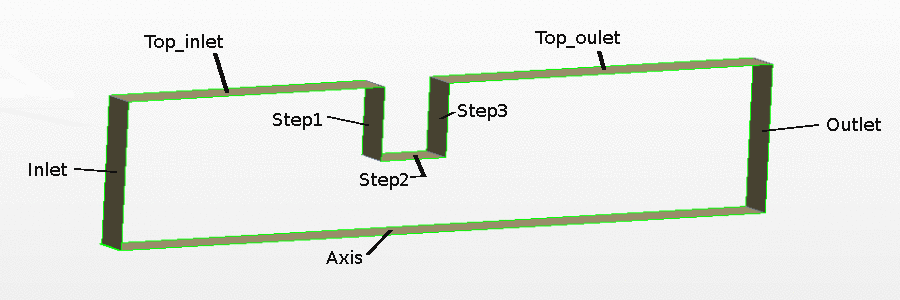
Each of these faces should now appear in the Bodies > orifice_plate > Named Faces node as shown below

Click Close 3D-CAD button and then Save your work.
Step 5. Creating a Region to Model.
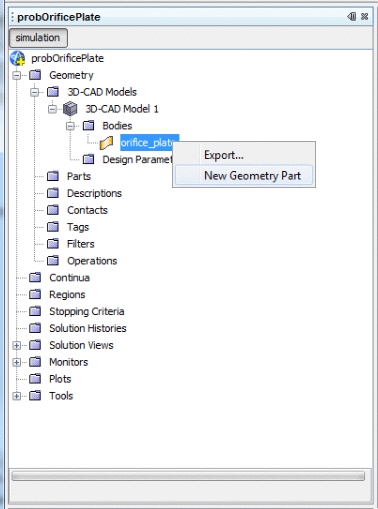
Right click the Geometry > 3D-CAD Models > 3D-CAD Model 1 > Bodies > orifice_plate node and select New Geometry Part. Click OK in the next window without changing any settings.
Right Geometry > Parts > orifice_plate and select Assign Parts to Region.
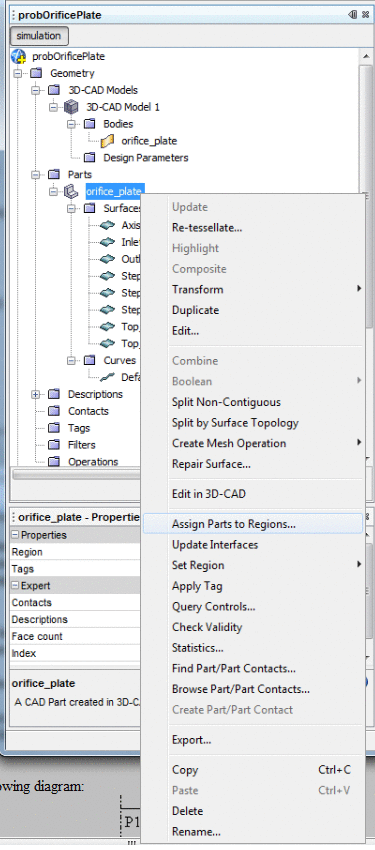
Make sure you select Create a Region for Each Part and Create a Boundary for Each Part Surface before clicking Apply and Close.

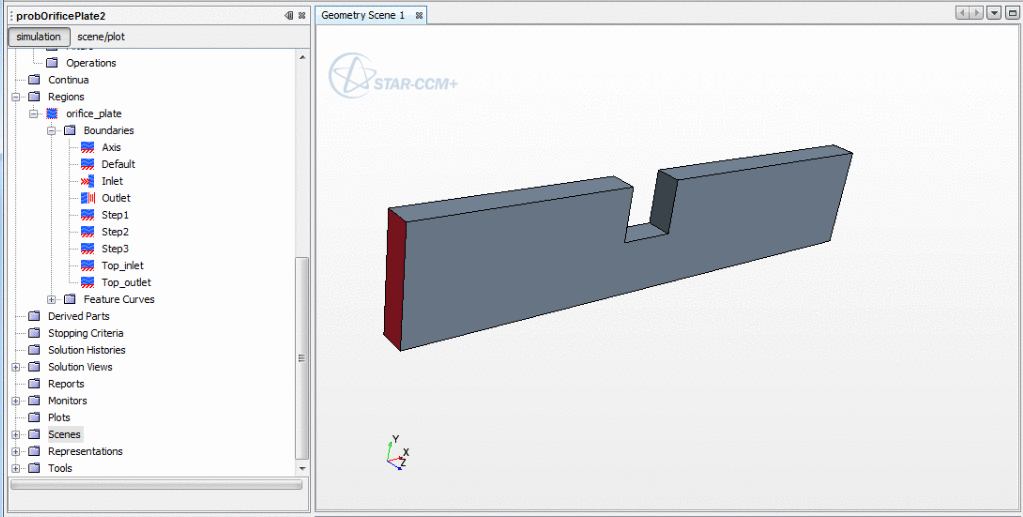
To visualize your region, right click the Scenes node and select New Scene > Geometry.

Note the boundaries will also show up in in Regions > orifice_plate > Boundaries. Your screen should look like:
Save your work!.
Step 6. Creating Boundary Conditions.
Select the Regions > orifice_plate > Boundary > Inlet node and set the Type to Velocity Inlet

Select the Outlet node and set the Type to Pressure Outlet
Select the Axis node and set the Type to Axis
Select the Default node and set the type to Symmetry Plane. The rest of the boundaries will remain as Wall type.
Save.
Step 7. Creating the Mesh.
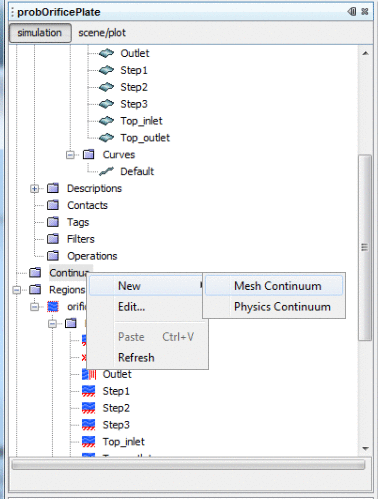
Generate a volume mesh using the trimmer mesher. Right-click the Continua node and select New > Mesh Continuum
Right-click the Mesh 1 > Models node and choose Select Meshing Models

In the Meshing Model Selection dialog select Surface Remesher from the Surface Mesh box and Trimmer from the Volume Mesh box. The window should look like the image below. click Close when finished.

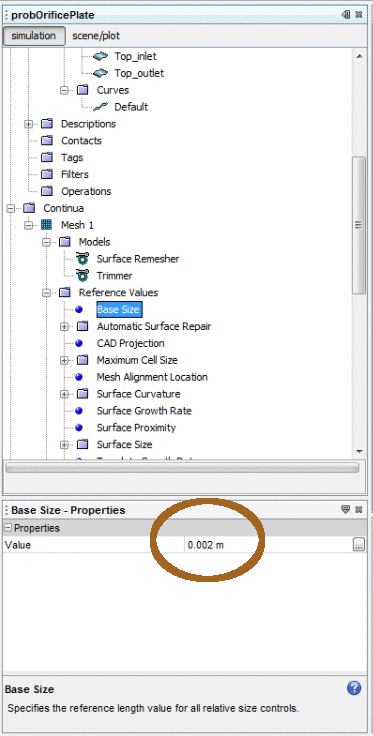
To edit the base size of each grid, select the Mesh 1 > Reference Values > Base Size node and set the Value to 0.002 m. Note, this is fairly coarse. Decreasing this value will result in a more accurate solution, but will take longer to compute. For your assignment you will have to find the best grid size and type on your own. It is a good idea to try the Steady Flow: Channel Flow with Multiple Meshes tutorial in the Tutorial Guide to learn about different mesh types. See Getting Started with Star-CCM+ for instructions on accessing the Star-CCM+ Tutorial Guide.
Save the simulation.
Step 8. Generate the Mesh and Convert from 3D to 2D.
Click the Generate Volume Mesh Button  . Then to visualize, create a Mesh scene by Right clicking the Scenes node and selecting New Scene > Mesh

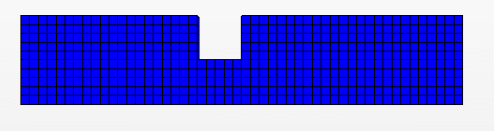
Your grid should look like:
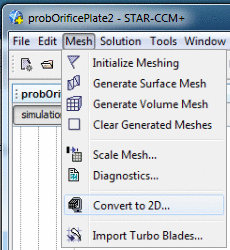
If you are satisfied with how the grid looks, now convert it to 2D. Select Mesh > Convert to 2D from the menu.
Accept the default settings and click OK. Click reset view  to bring everything back into view.
This process creates a new region and physics model. Now we need to disable the physics in the old region so that we only compute the 2D solution. To do this, Left-click the Regions > orifice_plate node. Change Physics Continuum to None.
Step 9. Selecting the Physics Models.
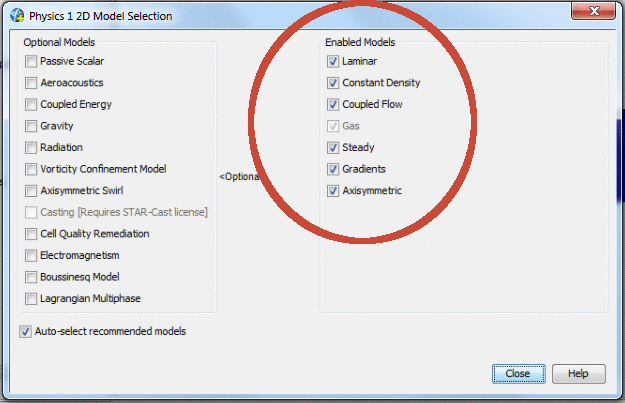
Right-click the Continua > Physics 1 2D > Models node and choose Select models.

Choose the following options: Axisymmetric, Steady, Gas, Coupled Flow, Constant Density, Laminar. Your window should then look like the image below. For your assignment, you can pick the k-epsilon turbulence model instead of laminar here. For more information, see the Star-CCM+ Tutorial and User Guides, particularly the Introduction tutorial. See Getting Started with Star-CCM+ for instructions on accessing the Tutorial Guide. Click Close
Step 10. Selecting the Material Properties, Initial Conditions, and Boundary Condition Values.
Select Continua > Physics 1 2D > Models > Gas > Air > Material Properties > Density > Constant node and set the Value to 1.2 kg/m^3

Similarly, Select Continua > Physics 1 2D > Models > Gas > Air > Material Properties > Dynamic Viscosity > Constant node and set the Value to 1.8E-5 Pa-s.
Next, Select the Continua > Physics 1 2D > Initial Conditions > Velocity > Constant node and set the Value to [1.0E-4, 0.0, 0.0] m/s.
For the Inlet condition, open the Regions > orifice_plate 2D > Boundaries > Inlet > Physics Values > Velocity Magnitude > Constant node and set the Value to 1E-4 m/s.
Step 11. Run the Simulation.
Set the number of iterations under Stopping Criteria > Maximum Steps. Set its value to 500.

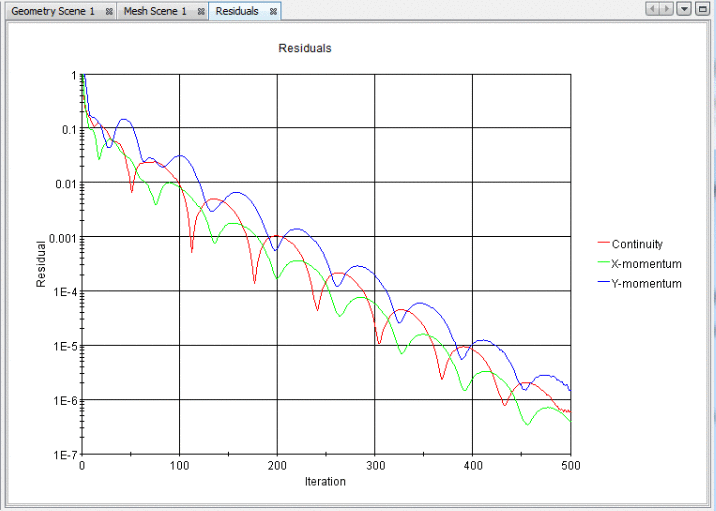
Run the simulation with the Run button:  . Your screen should look like this after some time passes, indicating a converged solution (i.e. errors should be minimized with larger number of iterations):
Note, you can always stop the simulation process with the Stop  button, and examine the current solution. You can then change the Stopping Criteria if desired and continue running from the current iteration with the Run button. To clear your solution to start from the beginning, Click on the Solution menu item and click Clear Solution.
To get the CPU run time, right click on the Reports node and click on New Report > Total Solver CPU Time. A new node will appear under reports.Reports > Total Solver CPU Time Double clicking this node will output the CPU run time in the output window.
Step 12. Visualize the Results.
To show the velocity vectors, which indicates direction of fluid motion, right click Scenes node and select New Scene > Vector. By default it should show velocity vectors:
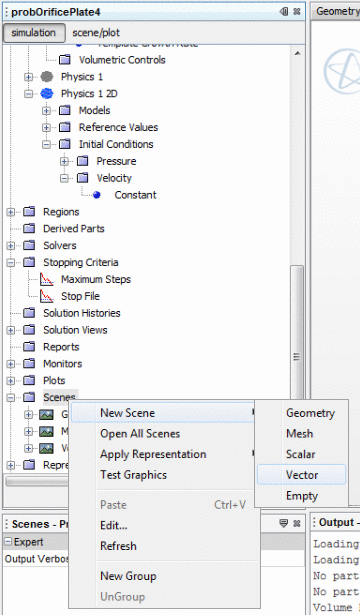
You can change the size of the vector arrows by opening the Scenes > Vector Scene 1 > Displayers > Vector 1 > Glyph > Relative Length node and changing the Glyph Length to 10%. Your scene should then look like:

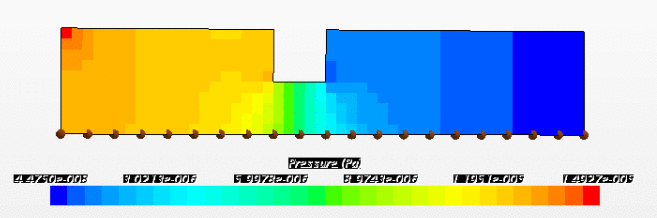
For a pressure contour plot, right click Scenes node and select New Scene > Scalar. Then right click the blue bar that appears on the screen and select Pressure. You can also plot other various properties like x-velocity or y-velocity, or total velocity using this method.

Finally, you can save your scenes to png image files by right clicking on the desired Scene node, and clicking on Hardcopy.

Save.
Step 13. Extracting data from the simulation.
A useful step for comparing different grid sizes, is to extract useful information like pressure along the axis of the pipe. To do this, you must create a probe line along the axis, then make a plot of the data. Start by right clicking on the Derived Parts node and select New Part > Probe > Line....

This brings up a window where you can choose the start and end locations of the line probe. Choose Point 1 to start at the origin [x=0.0m, z=0.0m, z=0.0m] and Point 2 should end near the outlet. In this example, point 2 should be at [x=0.1m, z=0.0m, z=0.0m]. If you have a Scene open in the right window, it should show you where the end points of the probe line will be:

Click Create then Close. Your probe line should be visible on the screen:
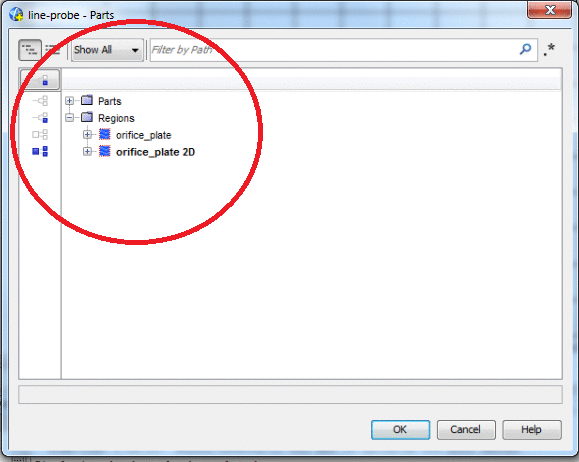
Now left click on the new Derived parts > line probe node and make sure your 2D region is selected in the Parts property. You can select what region and surface is probed by clicking the ... button under :

Doing so brings up a Parts window, where you can de-select the 3D region, and select the 2D region as shown, then click OK:
Now we have to create the plot. Do this by right clicking on the Plots bode and select New Plot > X-Y.

This creates a new XY Plot 1 node under the Plots node. Left click the XY Plot 1 node and make sure it is plotting for the line-probe we just created. To do this, click the ... button under the property:
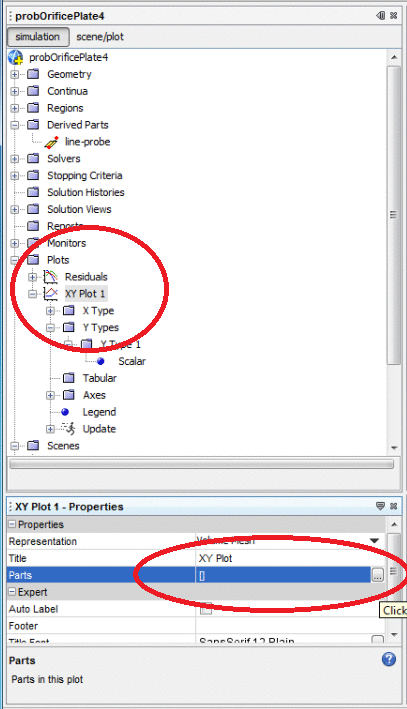
This brings up the Parts window again. Make sure Derived Parts > line-probe is selected as shown, then click OK:

By default the X-axis will plot distance. We still have to specify what to plot on the Y-axis. Open up the Plots > XY Plot 1 > Y Types > Y Type 1 > Scalar node as shown. Left click on the Scalar node and change the type to Pressure as shown:

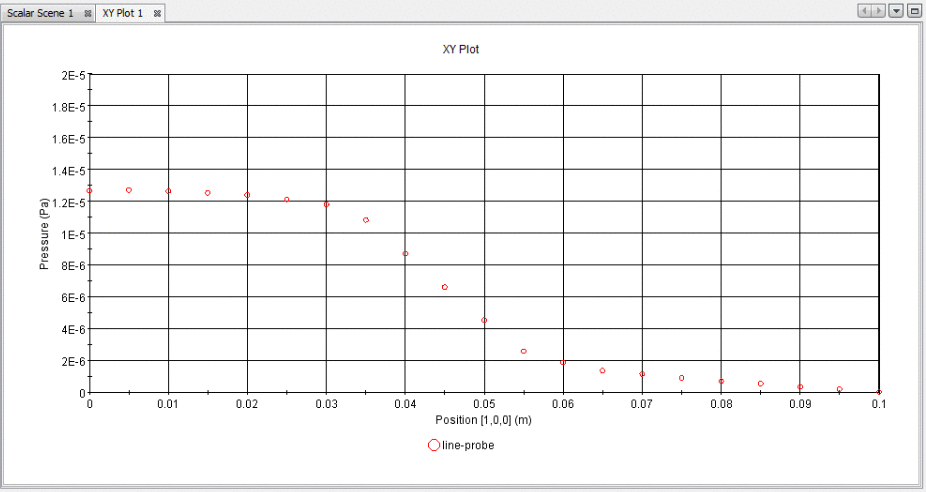
This should create a plot for you that looks like the image below. You can customize your plot and export data by exploring options in the Plots > XY Plot 1 node tree. Now you can compare pressure profiles for different simulations!
Save and now you are done and ready to start working on your assignment! Also note, it is a good idea to save your simulation as a different filename when you change the grid size or inlet velocity. That way you can open up your old simulations at any time to extract information without having to re-run them.